First of all, I want to thank you for your amazing product.
I have tried several different programs, but I chose yours. I really like it, and the fact that this forum has been around since 2008 only confirms that you are a true expert with invaluable experience in this field.
I have been using the program for almost a month now, and I am trying to minimize the Load/Unload Cycle Count on my WD Blue HDD.
What I Would Like to Suggest
1. More Frequent SMART Graph Updates
I would like the graphs in the SMART tab to update at every polling interval (e.g., every 5 minutes, as I have set in my settings) instead of once every 24 hours. This could work similarly to how the Temperature graph updates.
It would be great to have an option (such as a checkbox) to switch the SMART graph from a 24-hour interval to a 5-minute interval, or alternatively, an additional graph next to the 24-hour one.
My Load/Unload Cycle Count is increasing too quickly, and I would like to analyze how often it grows. Currently, I can only track daily changes, which is not detailed enough.
-
- Daily SMART graph
- 2025-03-05_142344.jpg (105.48 KiB) Viewed 2711 times
- Temperature graph
- Temp 2025 03 05.jpg (214.91 KiB) Viewed 2711 times
2. Displaying Relative Changes in SMART Graphs
I would also like the SMART graphs to show relative changes in addition to absolute values. For example, if the value was 200 yesterday and 210 today, it could display (+10) next to it.
This could be displayed in brackets, at the bottom of the graph, or in any other convenient place.
I have been trying to minimize the Load/Unload Cycle Count on my HDD for about a week now. While manually calculating the changes is not difficult, it is inconvenient. A visual representation of daily differences would help me quickly understand whether my actions are effective in reducing the count.
-
- Example of implementation
- 2025-03-05_155530.jpg (105.22 KiB) Viewed 2711 times
The Performance tab’s Transfer Rate graph currently uses the historical maximum speed as the highest value on the Y-axis.
It would be much more useful if the maximum scale reset every 3–5 minutes to better reflect the current state.
For example, in the screenshot below, the historical max speed was 385 MB/s, but my disk usually operates at 1–2 MB/s. As a result, the actual values remain at the very bottom of the graph, making it difficult to assess current performance.
-
- Performance graph
- 2025-03-05_155757.jpg (45.16 KiB) Viewed 2711 times
Final Thoughts
I also want to thank you once again for this incredible software.
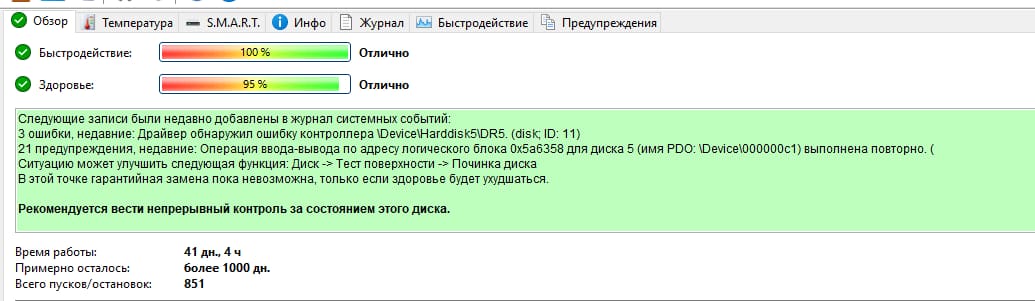
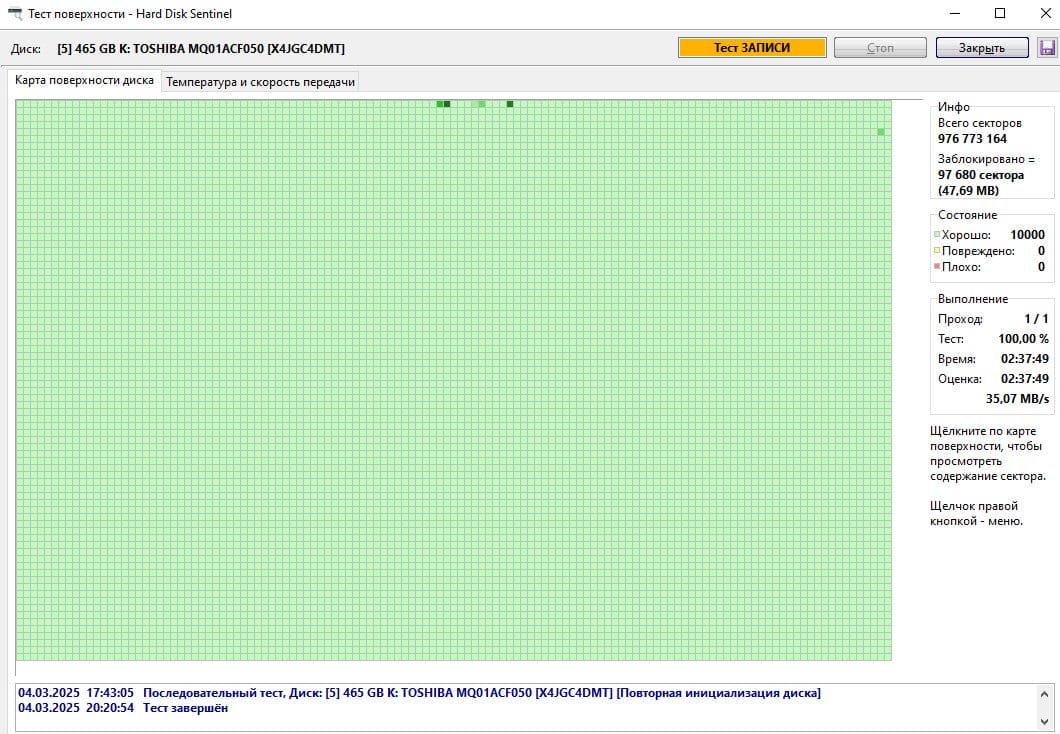
Thanks to HDD Sentinel, I remembered that I had an old Toshiba 500GB 2.5” USB drive, bought in 2015 and rarely used. Running an Extended Self-Test revealed its terrible condition—14% health, 82 bad sectors, and 664 weak sectors.
-
- SMART graph with red warnings
- 2025-03-04_171737.jpg (123.65 KiB) Viewed 2711 times
-
So, thank you once again for your outstanding product.
-
By the way, if you ever need help with translations, feel free to let me know. I would be happy to volunteer for translating into Ukrainian and Russian.
-